

- Home
- Companies
- Precision Planting - An AGCO brand
- Products
- Precision - Model Clarity - Advanced ...
Precision - Model Clarity -Advanced Flow and Blockage Metrics
Standard blockage systems tell if a product is flowing, but that’s about it. Clarity offers high-definition visibility into air seeders, box drills, dry fertilizer applicators and strip-till bars in real-time. The Clarity system displays and maps flow variability and product blockage metrics, row-by-row, on the 20|20 monitor in the cab.
The only real-time, row-by-row blockage system on the market.
High-Definition Visibility With the 20|20
The Clarity system displays and maps blockage variability and product blockage metrics, row-by-row, on the 20|20 monitor in the cab. Instead of just red or green lights, you`ll see numbers and statistics tied to the performance of the product delivery system, giving you more accuracy than standard systems on the market.
Faster Awareness of Product Flow Reduction
With the 20|20 in the cab, you can identify a problem while still in the field, rather than after the crop emerges. Catch a reduction in product flow from an issue with a partial plug or a metering issue with the 20|20. Don`t let your crop suffer from an issue that you don`t know about until it`s too late.
Row-by-Row Mapping
Clarity maps product distribution through a vast array of colors in high-definition that illustrates detailed data per row. Pinpoint if there’s a blockage or drop in product flow quicker and more accurately. And if you are applying more than one granular product, see which one is causing the problem instead of taking a 50/50 guess.
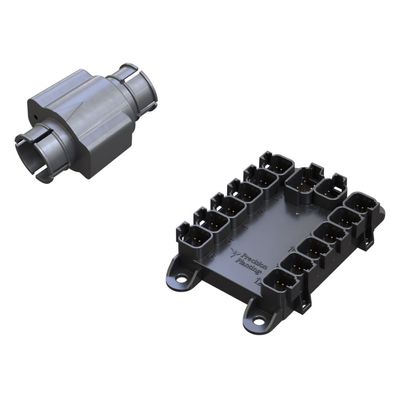
The Clarity system uses optical blockage sensors that you potentially already have on your equipment, paired with a Blockage Expansion Module and a Gen 3 20|20 monitor.
Clarity processes the optical signal differently than other systems, by looking at the percentage of time that product is detected by the sensor. This percentage is then converted to Magnitude, Uniformity and Deviation metrics that allow you to put hard numbers on the product distribution across the tool rather than relying on green or red boxes, or unlabeled bar charts.
- Product Magnitude: Shows the amount of product flowing through the sensors, giving you a row-by-row comparison. By watching this metric on the 20|20 monitor, you can quickly see any inconsistencies of product flow and investigate issues.
- Product Uniformity: A numerical percentage value that shows how even the system is delivering a product to each row. By using the product magnitude data, the system shows the distribution error across the implement, in a foot-by-foot average.
- Product Deviation: Displays how each row compares to the average magnitude being applied. This metric shows the percentage that a row is applying above or below the average.
- Ground Contact + Margin: How much additional downward pressure is being applied to each row unit to maintain even planting depth, provided by SeederForce.