

Farmroad Platform
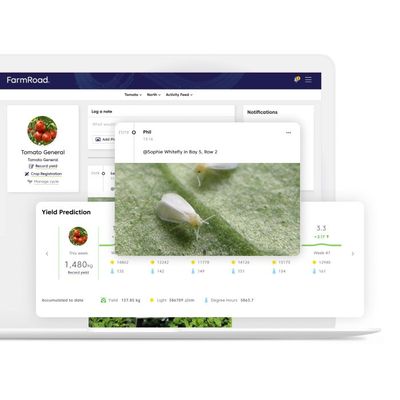
Farms rarely need more data, they need tools to understand and act upon the data they already have. FarmRoad’s graphing of data streams means you gain insights from combining never-seen-before data sets, revealing useful metrics like plant balance, forecasted vs actual yield, or labor productivity vs harvest weight.
Ensure vital farm and growing information is seen by the right people in your organization. FarmRoad’s customizable dashboards means visualizing only the important data and displaying it to those with the appropriate level of access.
-
Single platform for data unification
-
Powerful tools for visualization and analysis
-
User-selectable languages, timezones and units of measurement
-
Mix multiple data sets in any way you choose
-
Open APIs to integrate all data sources
-
Hosted on AWS with secure and customizable access
-
Activity feed keeps team members up to date
-
Harness weather, spot pricing or other market data
Display everything in your language and timezone
Wherever you are in the world you want your data displayed in your language, units and timezone. FarmRoad supports 8 languages, imperial or metric units and graphs data in local timezones