

Starpoint Software Inc.
StepMaster - Aquifer Step-Drawdown Pumping Test Analysis Software
Everyone performs step-drawdown tests but few people know how to analyze the data. Analyzing step-drawdown tests requires the use of complex graphical techniques which are not widely taught. StepMaster uses graphical analysis methods to analyze step-drawdown tests quickly and reliably. No other program is designed specifically for Step-Drawdown like StepMaster.
Most popular related searches
- Eden-Hazel (step-drawdown and recovery to estimate aquifer transmissivity linear well loss coefficients)
- Birsoy-Summers (step-drawdown and recovery analysis to estimate aquifer transmissivity and storativity)
- Hantush-Bierschenk (to estimate linear and non-linear well loss coefficients)
- Accepts up to twelve pumping rates (it is not necessary for rates to be consecutively increasing or of the same duration)
- Write tab delimited tables of special values Eden- Hazel`s H and Birsoy-Summers adjusted time. This allows further independent analysis.
- All calculations are displayed in moveable, customizable text boxes.
- Arithmetic, Semi-Log, and Log-Log graphs
- Extensive ability to eliminate unwanted data or entire steps from the analysis
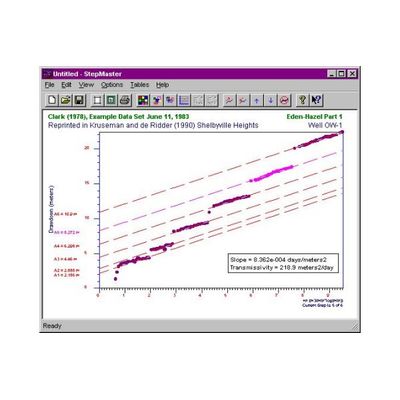
- The Eden-Hazel method is a two-part graphical analysis. The method provides estimates of aquifer transmissivity and an equation describing well drawdown with pumping rate as the independent variable. (15332 bytes)
- The Birsoy-Summers is a graphical method to provide estimates of aquifer transmissivity and storativity. (17720 bytes)
- Shown here is the Clark (1978) data set, in the first graph of the Hantush-Bierschenk analysis. The Hantush-Bierschenk method does not provide T or S, but does provide well loss coefficients and an equation describing well drawdown with pumping rate as the independent variable. (15531 bytes)
- Shown here is the Eden-Hazel method with the Calliope example data set published with the original Eden-Hazel paper. The Eden-Hazel method works with increasing or decreasing discharge rates as well as recovery data. (16216 bytes)
- Show here is an arithmetic time-drawdown graph where the initial step was pumped at a higher rate than subsequent steps. Even this data can provide reliable estimates of aquifer transmissivity with StepMaster. (15902 bytes)
- Shown here is the above data analyzed with the Eden-Hazel method. (18502 bytes)
- The Eden-Hazel method also provides transmissivity estimates for a simple constant rate pump test with recovery data, as shown here with an example data set from Todd (1980) (16505 bytes)
- Show here is a semi-logarithmic graph of the above recovery data. (14714 bytes)