
- Home
- Companies
- Phenospex B. V.
- Software
- HortControl - Data Visualize and ...
HortControl - Data Visualize and Analyze Software
HortControl is the central software to setup, visualize and analyze your PlantEye measurements. HortControl is designed to be used by staff with any professional background with a user friendly interface. You can access HortControl from your office or in the field.
- Experiment setup, control & monitoring
- Data visualization, visualize parameters from single plants up to entire plots
- Plant analysis apps, automated data analysis
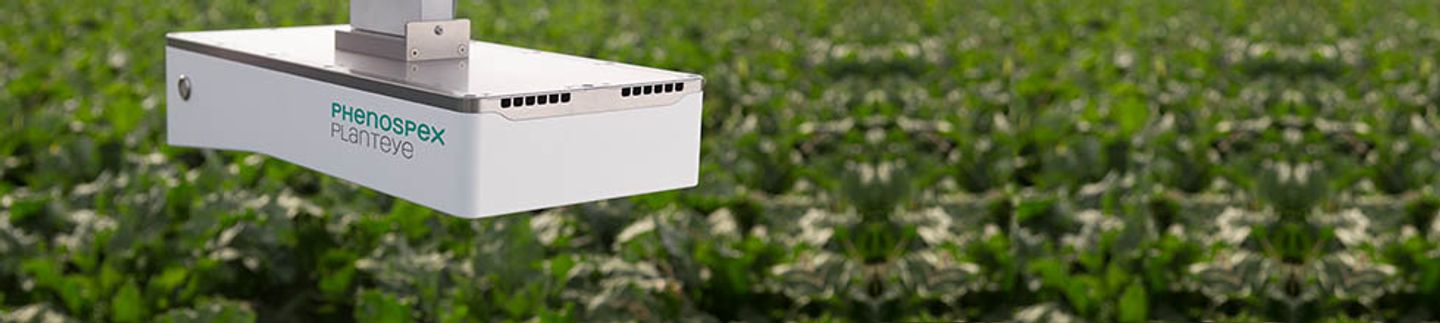
PlantEye generates 3D plant models with spectral information. Our software calculates many parameters from these models and stores them in HortControl. Data from single plants or even complete fields can be analyzed.
Experiment set-up, control & monitoring
Once your experiment is running you can monitor it and immediately start analyzing.
- Set-up experiments for large numbers of plants with different genotypes and treatment groups
- Monitor experiments in real time
- Monitor crops in real time
- Monitor hardware and sensors status
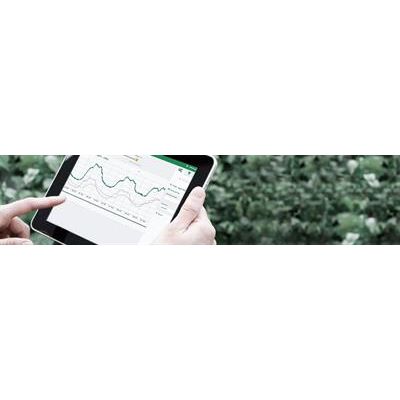
Visualize Plant Data
Visualize all plant parameters with HortControl. Easily create the graphs you need to analyze your plants with features like:
- Time aggregation
- Grouping on genotypes and/ or treatments
- Absolute or relative values
- Filter on time, treatment or genotypes
- Automated spectral data analysis
Visualize the 3D model when you see interesting data or irregularities and get an in depth look of the plant.
Plant Analysis apps
HortControl has two great Apps/ Tools to automate specific data analysis applications commonly used in plant screening:
- Growth Analysis
- Germination Assays
PlantEye automates phenotyping in 3 steps:
- PlantEye Scans plants and creates 3D files
- 17+ plant parameters are calculated
- Plant data is Visualized and Analyzed