

Sima - Mobile App for Agriculture Solution
An intelligent agriculture solution that allows you to monitor your fields, geolocate data, analyze information, and generate spray application orders.
Collect and geolocate data in the field
What makes it smart? In a single system, you can keep track of weeds, pests and diseases or simply take photographs, voice notes or text.
View and analyze data
Use tables, graphs and interactive maps.
Generate and share reports
Automatically share the status of your fields and the result of your decisions through work orders.
Plant Stand Control
It allows you to count your plants and their distance with a simple photo taken from your cell phone.
Benefits
- Practicality
- Time Savings in the batch
- No tape measure is needed for monitoring.
Severity Control
The control of severity or disease of your crops can now be done through a photograph.
Benefits
- Unification of criteria for the entire work team.
- Further reduction of time in the batch.
A system prepared for everyone.
SIMA presents a system with international protocols, adapted to all types of crops.
Join the SIMA community and start making smart decisions backed by technical information for your area generated by our users: pest alerts, adversity control recommendations, climatic events, hybrids and most frequently used varieties. This and more in the most complete and intelligent agricultural app.
1. Time Savings
The smart application optimizes your work. SIMA`s agile and intuitive interface improves the overall registration process in the field. Instant data synchronization eliminates the time-consuming transcription process. Automatic alerts mean better decision making and predefined reports make it easier to communicate in real time.
2. Identification of Adversities
Our smart system provides photographs and descriptions for each type of adversity (weeds, pests, disease), facilitating identification. The monitoring methodology to be followed in each case is also indicated.
3. Unified Criteria
The system`s monitoring protocols standardize the data recorded by the entire work team, generating homogeneous and comparable information across work teams and fields. This is artificial intelligence at work in the fields.
4. Spatial Analysis
A platform that sees what no human could ever see is a smart platform. SIMA`s geolocation capacity analyzes data at micro levels, identifying problem areas like weed patches or pest attacks.
5. Organization of Data
Intelligence that organizes your data for optimal performance. SIMA sorts monitoring data by farmer/customer, farm, field and growing season. You can access this information stored in the application anywhere, anytime.
1. Planting and Harvesting Progress
Real-time sowing/harvesting progress reports, discriminated by machinery in use, to keep an updated record wherever you are. Measure day-to-day partial yields of your harvest.
2. Monitoring
Take offline the description, photos, protocols and thresholds of adversities (pests, weeds, and diseases) for each crop and record them with the possibility of georeferencing them and completing your monitoring activity with photos, videos, audios and notes.
Standardization of data by unifying criteria for the entire work team, plus generate reports automatically, optimize processes like data upload, horizontal and vertical communication, and their respective analysis.
3. Work Orders
Place spray, seeding, fertilization and harvest orders offline, using inputs already loaded in the system in a practical way, with the possibility of generating a record of your activities and sharing them with your work team, improving communication and simplifying field work.
4. Waypoints
Take photos, record videos and audios, and take notes and georeference them with your crops for more accurate and better control over fieldwork.
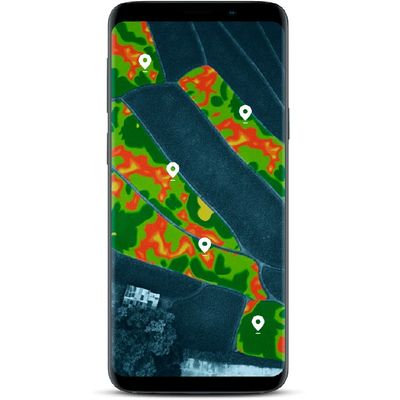
5. Vegetative Growth Map
Starting from an NDVI image, you can identify problem areas, define sub-plots, and make decisions with precision and certainty, even using waypoints, minimizing reliance on intuition and adding value to your business.
6. Stand Count Control
Now you can count your plants and the distance between them with a simple photo taken with your cell phone, saving you time and eliminating the hassle of using a tape measure.
7. Severity Control
The control of severity or disease of your crops can now be carried out by means of a photograph, which allows a unification of criteria for the entire work team, in addition to a greater reduction of time in the batch.
8. Silobag
Geolocate your silobag, monitor its status and perform waypoints for real-time control over your grain stock.
9. Planting Control
Control the quality of your planting in real time in a simple way, with the possibility of calculating the seed population and its deviation, allowing you to correct it at the moment.
10. Harvest Loss Control
Calculate in real time the state of the loss of the harvester without making calculations: just record the data obtained for a breakdown of the different machinery, so machinery can be calibrated properly, reducing loss during the harvest.
11. Satellite Images
Visualize the crops on your fields with NDVI, GNDVI and RGB images, make comparisons, define subplots and visualize sector-specific problems. This tool will allow you to make decisions efficiently and with greater precision.
12. Rainfall and Irrigation Records
Record all rainfall in each of your fields or farms, control the millimeters irrigated in each of your crops and attach geo-referenced waypoints.
13. Soil Works
Record all your work in an orderly manner, controlling the number of passes and the hours allocated to each task, digitizing every action for even more precise planning.
14. Field Monitoring (dashboard web)
View in real time the status of all your fields on our control panel, each one delimited and georeferenced on a satellite map. See the traffic-light alerts for all monitoring activity and spray applications for each crop and compare it with all the uploaded information.
You will have a record of the last 30 photos taken in the field, indicating the activity in each one and who took the photo; as well as a graph that shows the general state of each crop over the last 10 days. Thanks to this initial information, you can assess the state of your fields and delve into each of the activities to obtain more specific information and make more efficient decisions.