

- Home
- Companies
- CID Bio-Science, Inc.
- Products
- CID - Model CI-110 - Plant Canopy ...
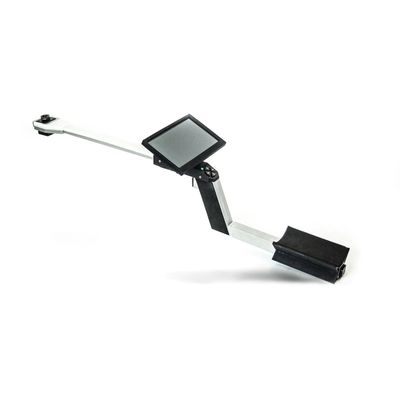
CID - Model CI-110 -Plant Canopy Imager
Leaf Area Index (LAI) is defined as one sided leaf area divided by the total ground area. Photosynthetically Active Radiation (PAR) designates the spectral range of solar radiation (400-700 nm). By measuring PAR and LAI simultaneously, one is able to calculate LAI and canopy parameters using a variety of methodologies.
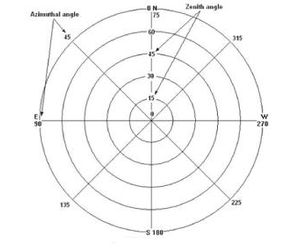
To calculate LAI, the CI-110 captures a 150° fisheye image of the canopy, which is divided into zenith and azimuthal divisions. Using the software included on the tablet computer, the user can include or exclude any zenith and azimuth division to focus on specific portions of the canopy for study.
The most practical method for non-destructive LAI measurement is the Gap Fraction Method. Gap Fraction indicates how much of the sky is visible from beneath the plant canopy. The greater the area of sky that is visible, the larger the gap fraction.
When using the CI-110, a value between 0 and 1 is assigned to estimate the Gap Fraction in a canopy—0 means that no sky is visible below the plant canopy whereas 1 means that the entire area is sky is visible, or there is no foliage coverage. Any fraction indicates partial foliage cover.
Images taken with the CI-110 are divided into sectors according to the user-selected number of zenith and azimuthal division. The fraction of the sky (solar beam transmission coefficient) that is visible in each sector is automatically analyzed by tallying the sky portion of the image pixels in that sector. Once all sectors are analyzed and the average solar beam transmission coefficients for each zenith division are computed, the hemispherical diffuse radiation transmission coefficient (the sky view factor), mean foliage inclination angles, and plant canopy extinction coefficients are instantaneously computed by CI-110`s analysis software.
- Lens: Self-leveling hemispherical lens
- Image Resolution: 8 megapixels
- Interface: USB and Wifi
- Measuring Time: < 1 second
- Fish-eye Lens Angle: 150°
- Operating Temperature: 5 to 50° C
- Camera Sensor: 5 cm x 5 cm
- Total Length: 84 cm
- Imaging Probe and Arm Weight: 1.5 kg
- PAR (Range / Accuracy): 0-2500 umol m2s / 5 umol m2s
calculation
Single measurement for comprehensive data collection and instantaneous, in-field calculation with integrated software.
touch screen
On-board touch screen allows for WYSIWYG application, rapid analysis, and evaluation of measurements.
150° viewing angle with live-updating high-resolution fish-eye digital image. No above-canopy reference measurement required.
sunflecks
On-site evaluation of solar beam transmission coefficients or gap fractions and ceptometer with 24 photodiodes to measure Sunflecks in the range of Photosynthetically Active Radiation.
Measurements can be taken of virtually any crop or forest – low lying plant canopies up to forest canopy in overcast or full sun environments.
Internal compass and GPS, digital masking, color filters, and user-selected number of zenith and azimuthal divisions give the user complete control over measurements.