
- Home
- Companies
- Stevens Water Monitoring Systems, Inc.
- Products
- SoilMoisture / Stevens - Soil Moisture ...
SoilMoisture / Stevens - Soil Moisture Retention Curve Analysis
Developing soil moisture retention characteristics of a soil or soil moisture release curve is at the core of soil hydrology studies that aim to understand soil water-plant-atmospheric systems, recharge processes, enhance hydrological models used in climate studies, carbon respiration and sequestration processes, and more. A soil moisture retention curve (also called the soil water retention curve or soil water characteristic curve) is a graph that shows the relationship between the soil water content and the soil water potential (or matric potential). It describes how tightly water is held in the soil and how much water is available to plants or for other applications.Measuring the soil moisture retention curve matters because it provides critical insight into how water behaves in soil, which directly impacts agriculture, hydrology, and environmental management. The retention curve shows how much water soil holds, when the soil releases it, and how accessible the water in the soil is to plants and processes—making it a cornerstone of both agronomic and environmental science. Here's why it's important:
- Drives water movement in soil and into plants (from higher to lower potential).
- Determines plant water availability.
- Essential for irrigation planning, soil modeling, and hydrology.
- Inputs for hydrological and climate models.
- Soil health, land slides, and engineering.
- Environmental and stormwater monitoring.

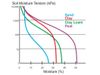
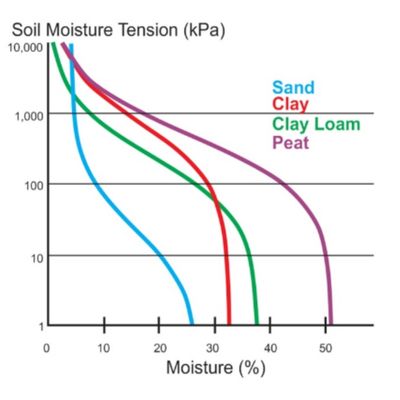
• At high water contents (near saturation), the soil water potential is close to 0 (water is loosely held).
• As the soil dries, the water potential becomes more negative (water is held more tightly).
• The shape of the curve depends on the soil texture and structure:
o Sandy soils release water quickly (steep curve).
o Clay soils retain water more tightly and release it more slowly (flatter curve).
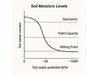
• Saturation = maximum water content.
o The soil's pores are completely filled with water.
o Often happens immediately after heavy rainfall or irrigation.
o Water is held loosely, and excess drains due to gravity.
• Field capacity: The amount of water the soil holds after gravity drainage stops.
o The point where all gravitational water has drained, but the soil still retains water in its pores.
o Represents the maximum water soil can hold against gravity, but that is still available to plants.
• Available water: The difference between field capacity and wilting point — the water plants can actually use.
• Permanent wilting point: Water is held so tightly that plants can no longer extract it
The soil moisture retention curve is determined through laboratory or field measurements that relate soil water content to soil water potential. Here's how it's typically done
A. Soil Sample Collection - Undistrubed or repacked soil cores are collected to preserve natural pore structure
B. Saturation - Soil sample is satuarated wiht water to ensure all pores are filled - the marks the starting point of the soil retention curve
C. Stepwise Drying and Measurements - over a defined pressures (decreasing water potential) the water content of the sample is measured at each stage and plotted along the curve. Such measurement can be achieved using a Tension Table / Hanging Water Column (0 to ~-30 kPa) or a Pressure Plate Apparatus (-30 to -1500 kPa)
D. Plotting the Curve - The soil water content vs soil water potential are plotted in kilopascals (kPa) pressure. The data is often fit to a mathematical model, such as the van Genuchten or Brooks-Corey model.
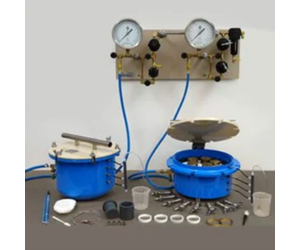
Part # with 110 V compressor: MC5-1 (5 bar) | MC15-1 (15 bar) | MC5N15-1 (5 bar and 15 bar)
Part # with 220 V compressor: MC5-2 (5 bar) | MC15-2 (15 bar) | MC5N15-2 (5 bar and 15 bar)
Part # with no compressor: MC5-N (5 bar) | MC15-N (15 bar) | MC5N15-N (5 bar and 15 bar)
The SoilMoisture tension Lab Setup consists of a Sandbox Tension Table connected to a hanging Water Column. The height difference between the surface of the saturated sand (shown in pink) and the dripping port of the Hanging Water Column determines the tension level applied.
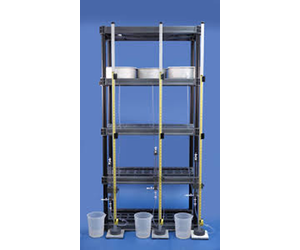
Part # MCT75: 3 X Sandbox Tension Table, 0 to 15 bar vacuum range (shelf in not included)
Part # MC2-TM5: 5 X TM5 Tempe Cell Setup, 2 bar application range